Stars · Asteroseismology
Asteroseismology
Stellar oscillations as precise measures of stellar masses and ages, from Kepler to Roman.
In brief
Stars ring like bells. Sound waves travel through a star's interior and set up vibrations, which make its brightness flicker by tiny amounts. Asteroseismology, "star seismology," uses these vibrations to see inside stars, much as seismologists use earthquake waves to study the inside of the Earth.
Red giants are especially good for this. Space telescopes such as Kepler recorded their brightness for years: a light curve. A Fourier transform turns the light curve into a power spectrum, which shows how strongly the star vibrates at each frequency. For a red giant, it is a comb of evenly spaced peaks (see the figure), summarized by two numbers:
- νmax, the frequency of maximum power, which depends on the star's surface gravity and temperature; and
- Δν, the spacing between the peaks, which depends on the star's mean density.
Scaling relations turn these two numbers, together with the star's surface temperature, into its mass and radius. Why two numbers are enough: νmax depends on mass and radius through surface gravity, and Δν through mean density, so together they pin down both. And a star's mass sets how long it burns hydrogen in its core; the red giant stage that follows is comparatively short. So a red giant's mass, together with its composition, gives a good estimate of its age. This works for many thousands of stars at once, and their ages tell us when different parts of the Milky Way formed: the subject of galactic archaeology.
The scaling relations are approximate. They are motivated by theory, but they need to be calibrated with stars whose masses or radii are known in other ways, for example radii from Gaia distances, and for the most luminous giants they show clear systematic offsets that have to be corrected. My work so far is on those corrections.
New to this topic? The Glossary explains the terms in plain language; underlined terms link to it.
What I have done
In APOKASC-3, the corrections tied asteroseismic radii to radii measured by Gaia, and the whole difference was ascribed to νmax. We proposed an alternative: since the corrections for Δν, which come from models, can be imperfect too, an arguably better use of the Gaia radii is to correct the asteroseismic radii directly (Cao and Pinsonneault 2025). The new formulation reduces the systematics in two ways: different asteroseismic methods agree better, and the results depend much less on how mean density is inferred from the oscillation frequencies. Compared with APOKASC-3, it also brings the lower and upper red giant branch into better agreement for α-rich stars, which are expected to have similar masses and ages on both: the difference between their median masses shrinks from 6.65% to 1.72%, and between their median ages from −21.8% to −9.6%.
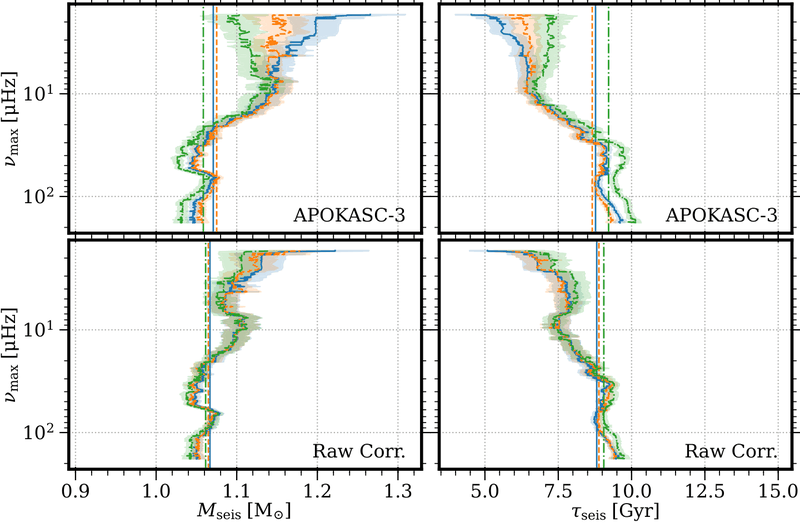
I also contributed to the APOKASC-3 catalog, especially the uncertainties of its spectroscopic measurements, and to related studies of red giants. Roman's Galactic Bulge Time Domain Survey is designed mainly to find exoplanets, but it will also be a great source of asteroseismic data, with far more targets than previous missions, in the Galactic bulge and center rather than the solar neighborhood: one forecast suggests oscillations in about 185,000 red giants in the bulge. I am a member of the Roman Wide-Field Science Team for asteroseismology with that survey.
Papers
First-author papers
- Toward Accurate Asteroseismic Masses for Luminous Giants
· DOI · arXiv:2508.06609 · ADS · Talks and posters: Galactic Genesis Working Group, 2025
Coauthored papers
- Beyond the Nyquist frequency: Asteroseismic catalog of undersampled Kepler late subgiants and early red giants
· DOI · arXiv:2508.15654 · ADS
I provided theoretical predictions of first dredge-up signals and took part in related discussions. - Modeling Asteroseismic Yields for the Roman Galactic Bulge Time-Domain Survey
· DOI · arXiv:2503.04999 · ADS
I took part in discussions of Roman asteroseismology and commented on the manuscript. - Red giants evolutionary status determination: the complete Kepler catalog
· DOI · arXiv:2411.03101 · ADS
I took part in discussions of how to tell first-ascent red giant branch stars from asymptotic giant branch stars. - APOKASC-3: The Third Joint Spectroscopic and Asteroseismic catalog for Evolved Stars in the Kepler Fields
· DOI · arXiv:2410.00102 · ADS
I took part in discussions of the catalog, contributed substantially to the uncertainties of its spectroscopic observables, and contributed to writing the paper. - Nature vs. Nurture: Distinguishing Effects from Stellar Processing and Chemical Evolution on Carbon and Nitrogen in Red Giant Stars
· DOI · arXiv:2403.03249 · ADS
I contributed to the uncertainties of spectroscopic observables in the APOKASC-3 catalog, provided theoretical insight into the first dredge-up, and commented on the manuscript.
What comes next
DynFlux: Roman's detectors are very sensitive, and most of the survey's asteroseismic targets are expected to be near or beyond saturation (Weiss et al. 2025, Figure 9). DynFlux aims at reliable time-domain photometry of saturated stars, starting from pixel-level calibration of saturated pixels. I also plan to help characterize the evolved stars Roman observes, and to combine the survey's thousands of exposures into deep images of the Galactic bulge.
How this fits into my next five years: Research Directions.
Terms on this page (13)
- Red giant, red giant branch
- A star that has run out of hydrogen in its core and swollen to many times its former size (up to a hundred times or more), with a cool, red surface. The red giant branch is the path such stars follow in the Hertzsprung–Russell diagram as they grow brighter.
- Kepler
- A NASA space telescope (2009–2018) that, in its main mission (2009–2013), measured the brightness of about 150,000 stars almost continuously for four years, mainly to find planets. Its light curves also revealed the oscillations of thousands of red giants.
- Light curve
- A record of an object's brightness over time.
- Fourier transform
- A mathematical tool that breaks a signal varying in time into the frequencies it contains.
- Power spectrum (of oscillations)
- How much a signal varies at each frequency, found with a Fourier transform; "power" because it measures the square of the variation's amplitude, as power in a wave does. For a red giant's light curve, it shows a comb of oscillation peaks.
- νmax (nu-max)
- The frequency at which a star's oscillations are strongest. It depends mainly on the star's surface gravity, and also on its temperature.
- Surface gravity (log g)
- The gravitational acceleration at a star's surface, g = GM/R². Astronomers quote log g, the base-10 logarithm of g in cm/s². The Sun's is 4.44 (about 27,000 cm/s², 28 times Earth's); most observed red giants' are about 1 to 3.5.
- Δν (large frequency separation)
- The regular spacing between the peaks in a star's oscillation power spectrum ("large" to tell it from smaller spacings between other kinds of peaks). It is set by the time sound takes to cross the star, and grows with the star's mean density (as its square root).
- Scaling relations
- Simple formulas that give a star's mass and radius from νmax, Δν and its surface temperature, by comparison with the Sun. They work well but need calibration and corrections.
- Galactic archaeology
- Reconstructing the history of the Milky Way from the ages, compositions and motions of its stars.
- Gaia
- A European Space Agency mission (2013–2025) that measured positions, distances and motions of more than a billion stars. A distance turns a star's apparent brightness into its true luminosity, and luminosity and temperature give its radius, independently of asteroseismology.
- Systematics, systematic errors
- Errors that push results in a consistent direction, instead of scattering them randomly. More data do not average them away, so they must be understood and corrected. Uncorrected noise patterns, such as stripes, can become systematics when they mimic the signal.
- α-rich population
- Stars with more "α elements" (such as oxygen, magnesium and silicon, which stars build by adding helium nuclei, or α particles) relative to iron than the Sun has. They formed early in the Milky Way's history, so they are mostly old.