Cosmology · Cosmological Inference
Cosmological Inference
What surveys like Roman's can tell us about the Universe, and how to extract it.
In brief
Cosmology asks what the Universe is made of and how it has changed over time. In its standard model, the Universe has been expanding since the Big Bang and is made of ordinary matter, dark matter and dark energy. The model has a few numbers, called cosmological parameters, that observations try to measure. Two of them appear often on this site. Ωm is the fraction of the Universe's energy today that is in matter, ordinary and dark (about 0.3; most of the rest is dark energy). σ8 measures how clumpy matter is on scales of tens of millions of light-years. These numbers also test the model itself: some weak lensing surveys have found matter slightly less clumpy than predicted from the cosmic microwave background, the light left over from the early Universe, a possible tension that Roman's precision can help settle.
Inference means going from data to these numbers, with honest error bars. A galaxy survey does not measure the parameters directly. It measures where galaxies are and what shapes they have. Theory cannot predict where each galaxy is, only the statistical pattern they form, so the data are condensed into statistics that theory can predict. For surveys like Roman's, the main ones are three two-point correlation functions: they ask how the positions and shapes of galaxies a given distance apart are related, on average (see the figure).
Distances come from redshift: as the Universe expands, it stretches light, so more distant galaxies look redder. The pattern of a galaxy's brightness across several color filters (photometry) shifts as its light is stretched, which gives an approximate redshift. Galaxies can then be sorted into redshift bins: slices at different distances, and so at different times in cosmic history.
Comparing the measured statistics with predictions for many possible parameter values shows which values fit the data, and how far they can change before the fit becomes poor: that range is the error bar (see MCMC and Fisher forecast). Before real data arrive, forecasts estimate how precise a survey can be and which choices in the analysis matter most. My work on this topic so far is such a forecast for Roman.
↓ compare with predictions for many possible values of the cosmological parameters ↓
New to this topic? The Glossary explains the terms in plain language; underlined terms link to it.
In more depth
In cosmological inference, two things matter most. First, the inferred model and parameters should be as accurate as possible. Second, since they are never perfect, we need to know how confident we can be in them.
For weak lensing, data and theory usually meet at the level of summary statistics. From the positions and shapes of galaxies, we calculate three two-point correlation functions: cosmic shear (the lensing of distant galaxies by the matter in front of them), galaxy–galaxy lensing, and galaxy clustering. Combined, they are known as a "3×2pt" analysis. Photometry in several bands gives each galaxy's approximate redshift, so the sample can be divided into redshift bins, which capture how the Universe changes over time. Comparing the measured correlation functions with predictions then tells us about the cosmological model and its parameters. Before the data arrive, forecasts tell us how tightly a survey can do this, and which choices in the analysis matter most.
What I have done
In our Project Infrastructure Team, cosmological parameters are inferred with CoCoA, which combines CosmoLike (theoretical predictions) with Cobaya (sampling the parameter space), usually by Markov chain Monte Carlo (MCMC). MCMC is robust but expensive, so for the team's first data challenge I led Fisher forecasts instead (Cao et al. 2026). The Fisher method approximates the probability distribution of the parameters as a Gaussian. That is only an approximation, but we found good agreement with MCMC, and Fisher matrices make it much easier to explore different scenarios.
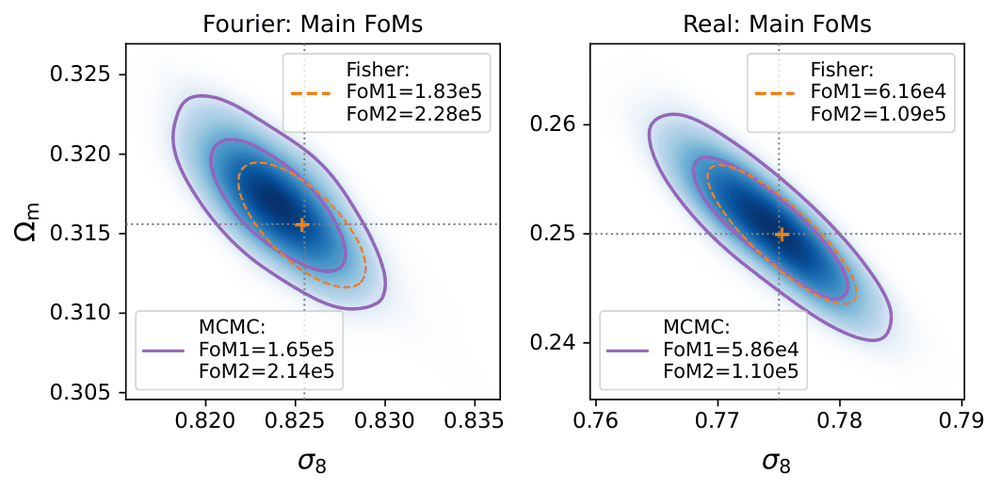
Under the challenge's assumptions, galaxy–galaxy lensing plus clustering constrain σ8 and Ωm more strongly than cosmic shear alone, and combining all three adds a further improvement. Tight external priors on the shape of the power spectrum improve the figures of merit by factors of 1.2 to 3.5; the smallest angular scales carry much more information than the largest, and the highest-redshift bins more than the lowest; and factor-of-two changes in the priors on photometric-redshift and shear biases change the figures of merit by 20% or less. I also contributed this experience with Fisher forecasts to a study of model approximations for Roman and Rubin.
Papers
First-author papers
- Fisher Forecasts for Cosmological Yields from 3×2pt Analysis of the Roman Space Telescope High Latitude Imaging Survey
· DOI · arXiv:2601.00438 · ADS · Talks and posters: COSMO-25, 2025, Michigan seminar, 2026, poster, Roman 2026
Coauthored papers
- Accurate modeling for 3×2pt analyses in Roman and Rubin: a study of model approximations
· arXiv:2606.23781 · ADS
I contributed my experience with Fisher forecasts.
What comes next
Depth Padding: a way to handle depth variation across a survey footprint, which comes from varying sky background, uneven tiling and instrument defects, so that cosmological inference becomes simpler.
How this fits into my next five years: Research Directions.
Terms on this page (17)
- Standard model of cosmology (ΛCDM)
- The current standard picture: the Universe has expanded from a hot, dense early state (the Big Bang); it contains ordinary matter, cold (slow-moving) dark matter and dark energy (Λ, the cosmological constant); and structure grew by gravity from tiny early ripples. A handful of cosmological parameters describe it.
- Dark matter
- Matter that does not emit or absorb light but has gravity. It makes up most of the matter in the Universe, and weak lensing measures it directly through its gravity.
- Cosmological parameters
- The handful of numbers in the standard model of cosmology, such as the amount of matter and how clumpy it is. Surveys try to measure them precisely, and to test whether the model itself holds.
- Ωm (omega-m)
- The fraction of the energy density of the Universe today that is in matter (ordinary and dark), about 0.3. Nearly all the rest is dark energy, which makes the expansion of the Universe speed up.
- σ8 (sigma-8)
- A measure of how clumpy matter is today: the typical relative fluctuation in the density of matter (as predicted by the simplest theory, which treats the fluctuations as small), averaged over spheres about 37 million light-years in radius. Cosmologists write this radius as 8 h−1 megaparsecs, where a megaparsec is about 3.3 million light-years and h ≈ 0.7 describes the expansion rate.
- Weak gravitational lensing
- The slight bending of light from distant galaxies by the gravity of matter in front of them, which stretches their images by about 1%. Averaged over millions of galaxies, it maps all the matter, including dark matter, and so tests cosmological models.
- Two-point correlation function
- A statistic that asks how a quantity at one point is related, on average, to the same or another quantity at a point a given distance away. For galaxies: are pairs found more often than by chance, or are their shapes aligned? Three of them are used together for weak lensing: cosmic shear, galaxy–galaxy lensing and galaxy clustering. Combined, they form a "3×2pt" analysis.
- Redshift
- The stretching of light to longer, redder wavelengths as the Universe expands while the light travels. More distant galaxies have larger redshifts, so redshift serves as a measure of distance and of cosmic time.
- Photometry
- Measuring how bright an object is, often through several color filters. Brightness in different filters gives information about color, and so about temperature or redshift.
- Redshift bins
- Groups of galaxies with similar redshifts: slices at different distances, and so at different times in cosmic history.
- Markov chain Monte Carlo (MCMC)
- A family of algorithms that explore the possible values of many parameters at once by taking a guided random walk ("Monte Carlo" for the randomness; "Markov chain" because each step depends only on the current position). The walk is built to spend more time where the parameters fit the data better, so a histogram of where it went shows the range of good values: the error bars. It is robust but computationally expensive.
- Fisher forecast
- A fast way to estimate how precisely an experiment will measure some parameters. It looks at how quickly the predicted measurements change when each parameter changes: the faster they change, the better the data can pin that parameter down. It assumes the probability of each parameter value falls off like a bell curve (a Gaussian) around the best value. Named after the statistician Ronald Fisher.
- Forecast
- An estimate, made before the data exist, of how precisely a survey will measure something, used to plan the survey and its analysis.
- Shear
- The stretching of an image in one direction and squeezing in the perpendicular one, which turns a circle into a slight ellipse. Weak lensing shears the images of distant galaxies by about 1%; cosmic shear is the pattern of this effect across the sky.
- Prior
- What is assumed about a parameter before looking at the data, for example a range from other experiments. "Tight priors" mean strong outside knowledge.
- Matter power spectrum
- How much the density of matter fluctuates on each length scale. It is the same idea as the oscillation power spectrum of a star, but over distances in space instead of frequencies in time. Many cosmological statistics, including those from weak lensing, are predicted from it.
- Figure of merit
- A single number that summarizes how precisely an experiment pins down a set of parameters; larger means smaller error bars.